|
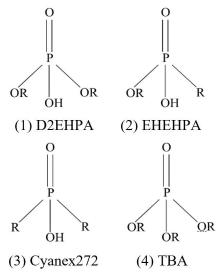 Fig.1
Structure diagram of typical organic phosphorus extractants
Fig.1
Structure diagram of typical organic phosphorus extractants
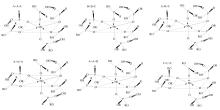 Fig.2
Schematic diagram of combined forms of synergistic extraction of phosphorus extractants[
Fig.2
Schematic diagram of combined forms of synergistic extraction of phosphorus extractants[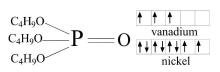 Fig.3
Neutral extractant and extraction electron orbit
Fig.3
Neutral extractant and extraction electron orbit
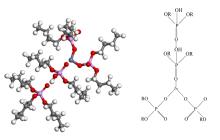 Fig.4
Co-extraction of Zn
Fig.4
Co-extraction of Zn
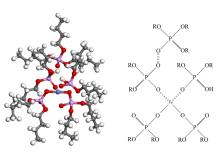 Fig.5
Co-extraction of Fe
Fig.5
Co-extraction of Fe
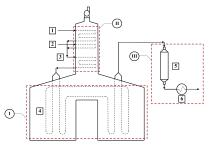 Fig.1
Schematic diagram of a typical ethane furnace[
Fig.1
Schematic diagram of a typical ethane furnace[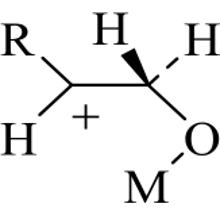 Fig.5
Metal oxygen intermediate[
Fig.5
Metal oxygen intermediate[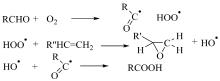 Fig.6
Benzaldehyde as an oxy transfer promoter[
Fig.6
Benzaldehyde as an oxy transfer promoter[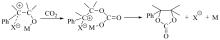 Fig.7
Halide ion stabilizes metal oxygen intermediate and catalyzes the carboxylation of epoxide[
Fig.7
Halide ion stabilizes metal oxygen intermediate and catalyzes the carboxylation of epoxide[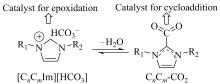 Fig.8
The equilibrium between the structure of catalyst [C n C m Im][HCO3] and its derived carbene-CO2 (C n C m -CO2)[
Fig.8
The equilibrium between the structure of catalyst [C n C m Im][HCO3] and its derived carbene-CO2 (C n C m -CO2)[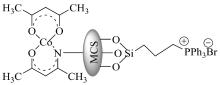 Fig.9
Structure of catalyst[
Fig.9
Structure of catalyst[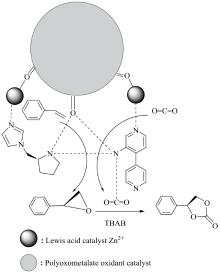 Fig.10
Catalytic mechanism diagram[
Fig.10
Catalytic mechanism diagram[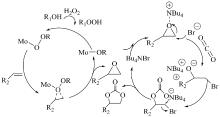 Fig.11
Catalytic process of molybdenum acetylacetonate [MoO2(acac)2] and TBAB[
Fig.11
Catalytic process of molybdenum acetylacetonate [MoO2(acac)2] and TBAB[ Fig.2
Principle diagram of catalytic coke[
Fig.2
Principle diagram of catalytic coke[|
|